Welcome to the Poverty Portal
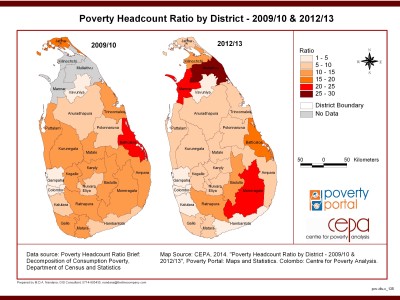
Poverty Headcount Ratio by District - 2009/10, 2012/13
This map shows the headcount ratio of poverty by Districts between the year 2009-2010 and 2012-2013.
Category: Poverty & Welfare Programmes
Map Description: This map shows the headcount ratio of poverty by Districts between the year 2009-2010 and 2012-2013.
Data Source 1: Poverty Headcount Ratio Brief: Decomposition of Consumption Poverty, Department of Census and Statistics
Data Source 2: p1, Poverty headcount ratio by districts-2009/10,2012/13
Map Level: District
Resource Format: Poverty Headcount Ratio Brief: Decomposition of Consumption Poverty, Department of Census and Statistics
Related
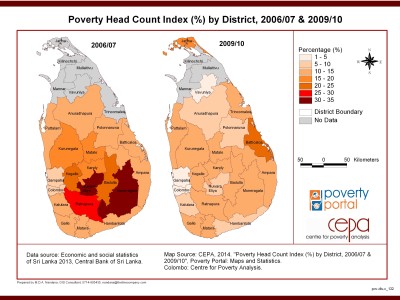
Poverty Head Count Index (%) by District, 2006/07 & 2009/10
View Details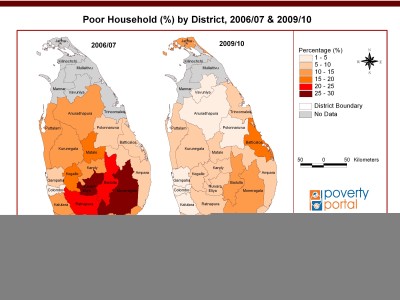
Poor Household (%) by District, 2006/07 & 2009/10
View Details