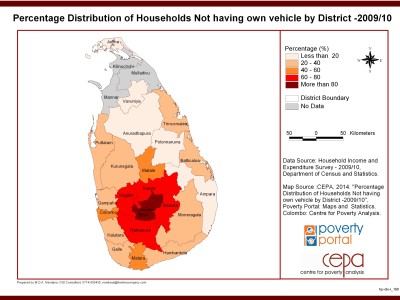
Percentage Distribution of Households Not having own vehicle by District -2009/10
This map shows the percentage distribution of households not having own vehicles by District between the years 2009-2010.
District | View More »
Percentage Distribution of Households Having own Motor Cars/ Vans and Buses/ Lorries by District -2009/10
This map shows the percentage distribution of households having own motor cars/vans/buses/ and lorries by district between the years 2009-2010.
District | View More »
Percentage Distribution of Households Having own Motor cycles/ Scooters and Three Wheelers by District -2009/10
This map shows the pecentage distribution of households having own motor cycles/scooters and three wheelers by District between the years 2009-2010.
District | View More »
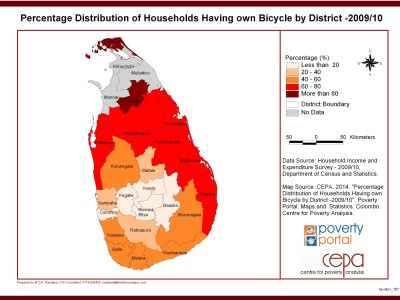
Percentage Distribution of Households Having Own Bicycle by District - 2009/2010
This map shows the percentage distribution of households having own bicyclcles by District between the years 2009-2010
District | View More »
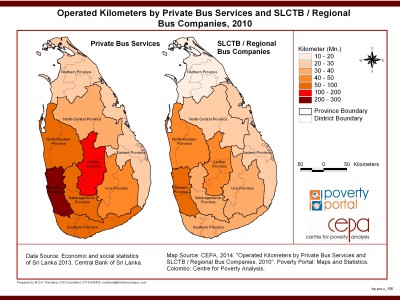
Operated Kilometers by Private Bus Services and SLCTB/Regional Bus Companies, 2010
This map shows the operated kilometers by private bus services and SLCTB/Regional bus companies in the year 2010
Province | View More »
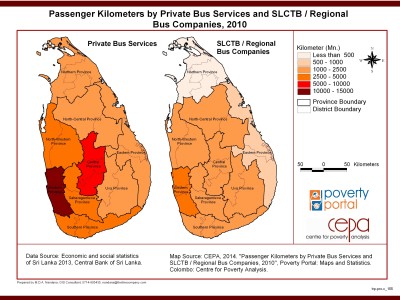
Passenger Kilometers by Private Bus Services and SLCTB / Regional Bus Companies, 2010
This map shows the passenger kilometers by private bus services and SLCTB/Regional bus companies in the year 2010
Province | View More »
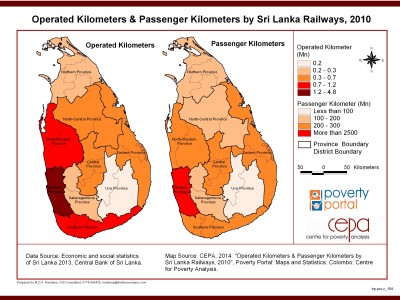
Operated Kilometers and Passenger Kilometers by Sri Lanka Railways, 2010
This map shows the operated kilometers and passenger kilometers by Sri Lanka railways in the year 2010
Province | View More »
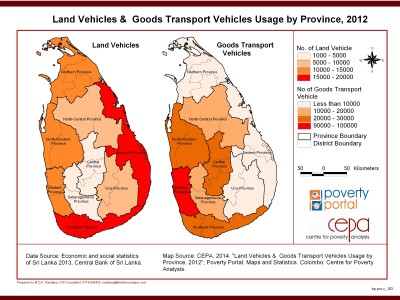
Land Vehicles & Goods Transport Vehicles Usage by Province, 2012
This map shows the usage of land vehicles and goods transport vehicles by Province in the year 2012
Province | View More »
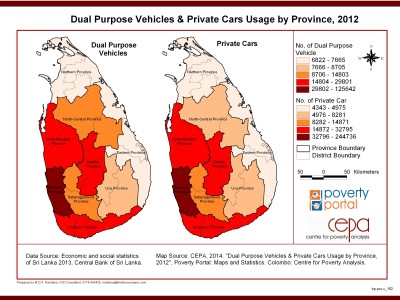
Dual Purpose Vehicles & Private Cars Usage by Province, 2012
This map shows the usage of dual purpose vehicles and private cars by the Province in the year 2012
Province | View More »
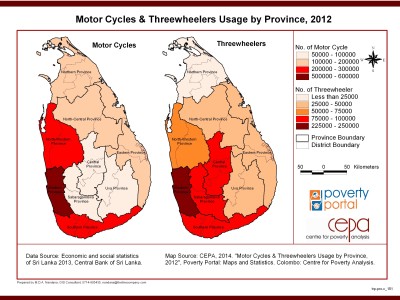
Motor Cycles & Threewheelers Usage by Province, 2012
This map shows the usage of motor cycles and threewheelers by Province in the year 2012
Province | View More »
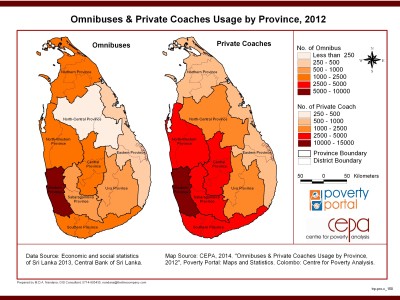
Omnibuses & Private Coaches Usage by Province, 2012
This map shows the usage of omnibuses and private coaches by Province in the year 2012
Province | View More »
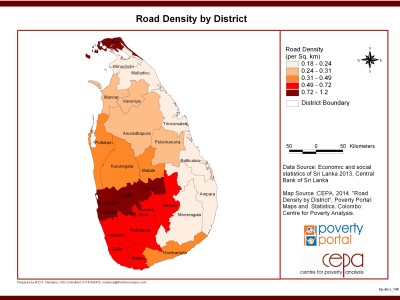
Road Density by District
This map shows the density of the road by District
District | View More »

